


In survey research, the common reflex is clear. Run the numbers. Check the p-value. Did the difference clear the 95% threshold? Was it “real”, or just noise?
That reflex - the data-reflex - works well in many areas of research. Trackers, ATUs, segmentations, and driver analyses often rely on reporting, supported by means or percentages from survey data. In these contexts, significance testing is standard and expected.
But conjoint results are different.
In conjoint methods where respondents trade off options (choice-based, allocation, etc.), they provide realistic choices, not isolated ratings. Each respondent evaluates a series of choice exercises designed to mimic actual decisions in the marketplace.
Those trade-offs are modeled to simulate products, prices, and competitive lineups. The output may resemble percentages, but they are not stated survey percentages. They are modeled outcomes - evidence of how consumers make trade-offs.
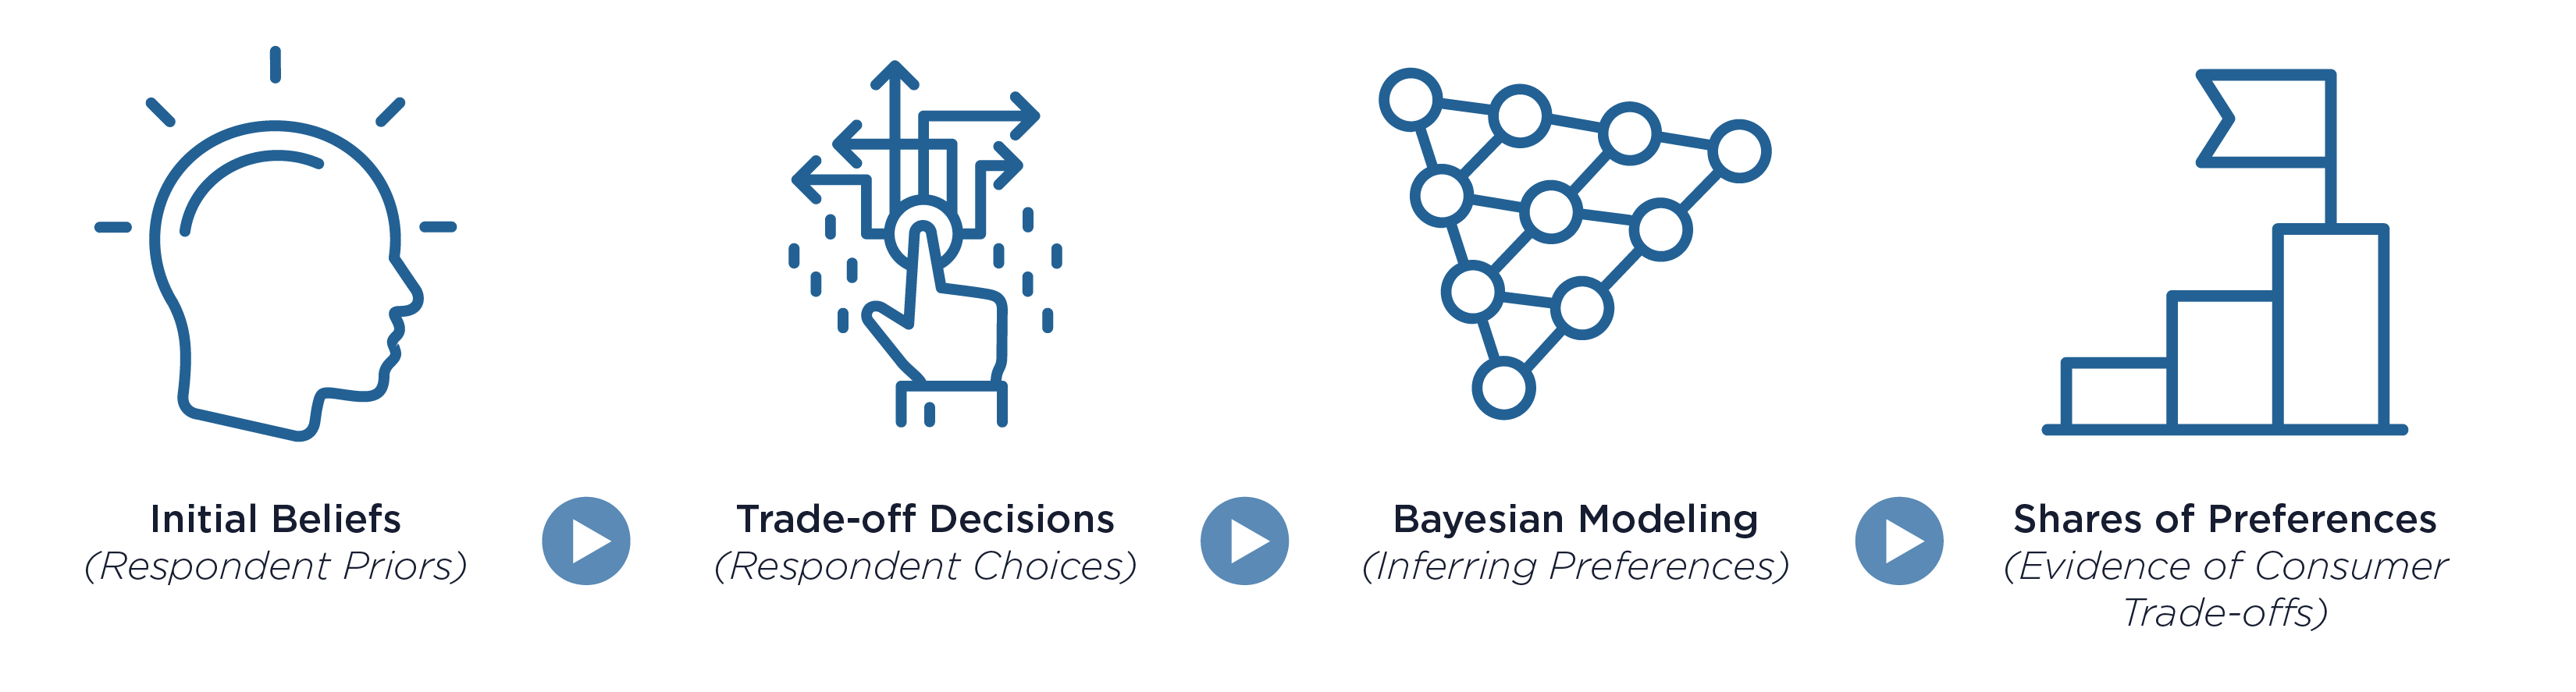
What makes conjoint distinctive is how it updates expectations with new data - a Bayesian process at its core. Think of it this way: respondents enter with prior expectations, just as they do in real life. Bayesian modeling captures this process - starting with prior patterns, then updating them with each new choice to build evidence of how consumers weigh features and make trade-offs. See this post for a more detailed explanation of Bayesian modeling.
Modeled estimates of shares are best understood as evidence of decision-making; not direct survey counts suited for significance testing.
The instinct to test conjoint preference shares in the same way we test survey percentages is common. But classic significance tests were designed for direct measures, not modeled outcomes. Applying them without caution creates a mismatch, because frequentist tests do not align with how conjoint modeling generates results.
Frequentist inference asks:“How likely are these results, assuming nothing is different?”
Bayesian inference asks:“How likely is this outcome, given the data we have?”
This is where the two perspectives diverge. The distinction is subtle but important: one is about the data under an assumption, the other about the probability of the outcome itself.
This is also where Bayesian tools become especially useful. Approaches such as credible intervals or win probabilities provide a better way to describe modeled outcomes - with probabilities that reflect confidence, rather than reliance on p-value thresholds.
The real issue is not whether a test can technically be applied. Both frequentist and Bayesian tests can provide useful perspectives, but neither, on their own, tells us what to do next.
The issue is: what does the shift in share mean for the business?
Consider a two-point lift in preference share within a conjoint study. On most survey sample sizes, it will not pass a significance test. On the surface, such a result might appear to be noise.
Yet once that lift is translated into market terms, the story changes:
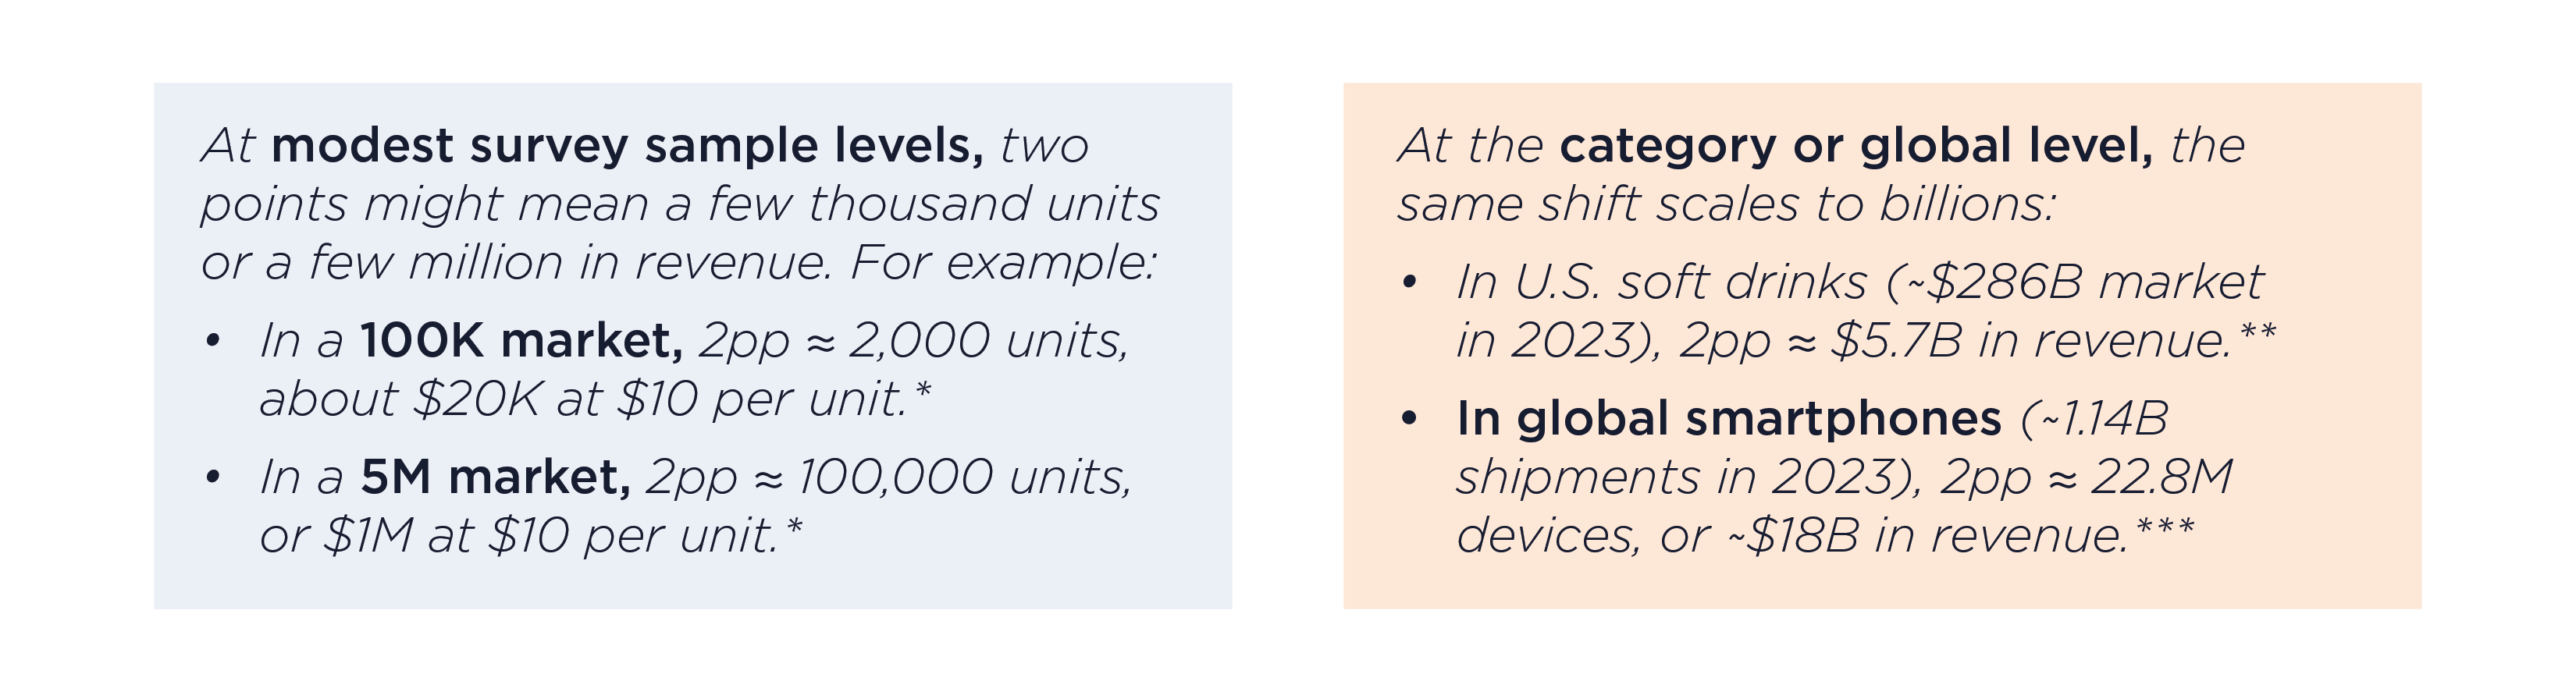
While a two-point lift might not clear a statistical threshold, it can still represent a material shift in competitive standing.
Not every share shift deserves equal weight. A structured approach helps keep results in perspective:
Though specialized Bayesian diagnostics such as credible intervals or win probabilities are a way to add additional perspective on the ‘strength’ of changes in preference share, they require significant computation and are used only in rare cases. When results are already anchored in units/dollars to provide a sense of the potential business impact, these specialized diagnostics may not add meaningful additional value.
This framework keeps interpretations balanced. It prevents over-interpreting small shifts, but also ensures we do not overlook commercially important ones.
At its core, conjoint is evidence-based in method but decision-driven in purpose.
When results are framed in terms of business impact, they become part of strategic discussions. Executives are less interested in whether a number passes a threshold and more concerned with which decision it supports.
In the end, analytics matter only when they sharpen strategy - and conjoint, read through impact, does exactly that.
* Illustrative calculations based on survey-level estimates.
** Grand View Research (2023, U.S. Soft Drinks Market).
*** Canalys (2023, Global Smartphone Shipments); IDC (2023, Global Smartphone Tracker); Statista (2023, Smartphone ASP).


